Categories
China Marketing

Rednote Data Analysis and Operation Ultimate Guide: From Basics to Viral Content Creation

01 Data-Driven Mindset: The Core Key to Advancing on Rednote

As a social e-commerce platform centered around “content-driven interest provoking & recommendation”, Rednote’s operational essence lies in achieving precise connections between content and users through its tag-matching mechanism. The platform’s algorithm distributes traffic by identifying both static tags (such as titles and keywords in the body text) and dynamic tags (real-time user interaction behaviors) of notes. To achieve effective growth on the platform, granular operational analytics serve as the core driving force.


The Three Core Values of a Data-Driven Mindset

1. Move Beyond Guesswork, Let Data Guide You

Many creators rely on intuition, leaving them confused about why some content goes viral while other pieces flop. Data analysis helps identify patterns and eliminates copycat anxiety.

 2. Precise Targeting, Eliminate Vague Strategies

Data reveals what resonates with your audience and what doesn’t. For instance, an “average view duration” below 10 seconds signals a weak hook, while a low “follower conversion rate” often points to an unclear creator persona.

3. A Repeatable Formula for Viral Content

Once you understand the data patterns, viral success can be systematically replicated. For example, analysis may show that prompting discussions in the comments can boost “completion rates” by over 20%, and using engaging “conversation hooks” can reliably increase interactions.


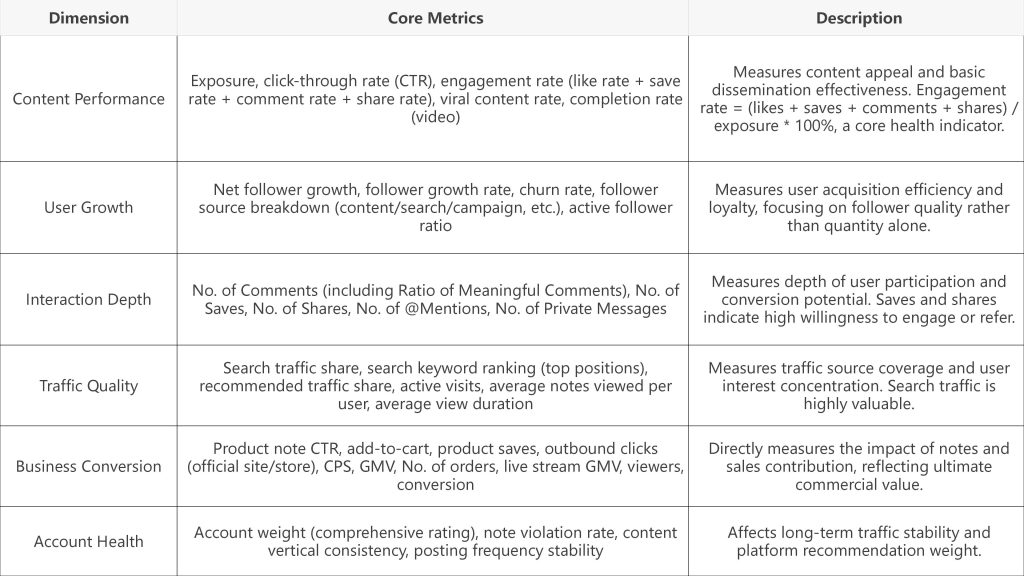
02 Core Analysis Dimensions and Metrics

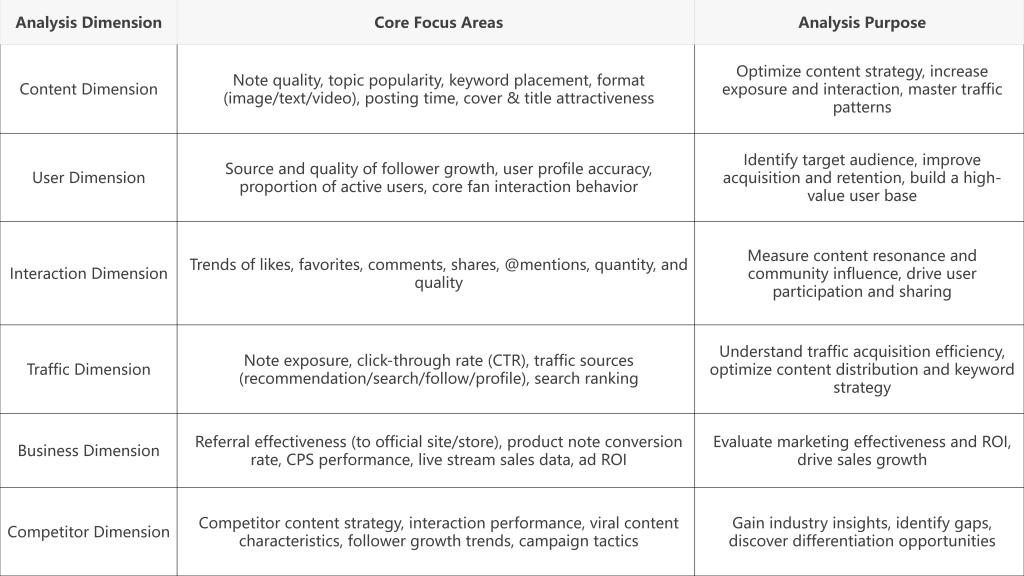
1. Six Key Analysis Dimensions

2. Key Analysis Metrics

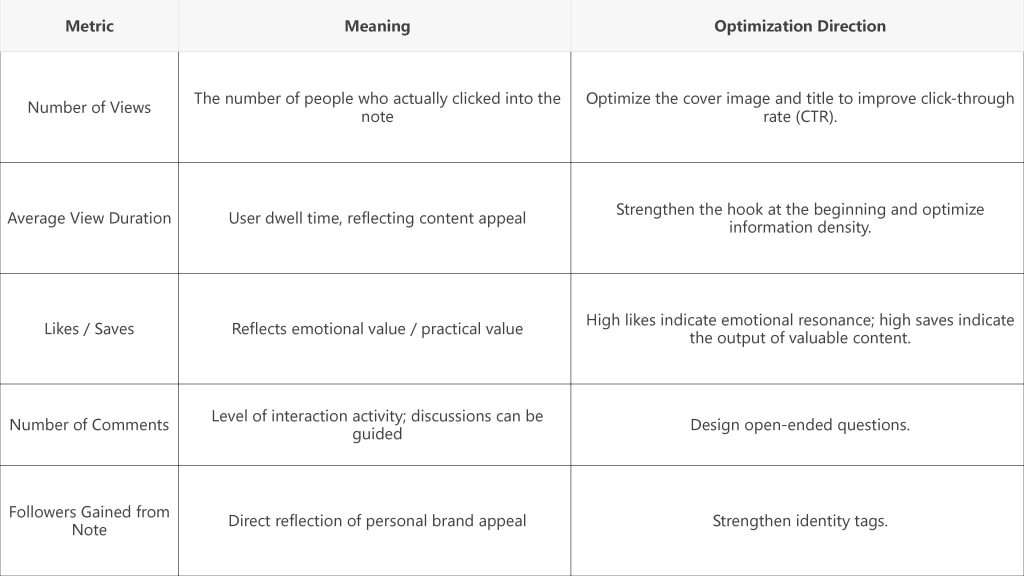
03 Single-Note Data Analysis: 8 Metrics to Thoroughly Understand Content Quality

1. Core Metrics Interpretation

2.The CES Algorithm: Rednote’s Invisible Distribution Logic

While not officially acknowledged by the platform, the widely referenced CES algorithm (like: 1 point + save: 1 point + comment: 4 points + follow: 8 points) can help understand Rednote’s content distribution mechanism.


04 Overall Account Analysis: Interpreting Operational Trends from Macro Data

Three Key Dimensions of the Creator Weekly Report

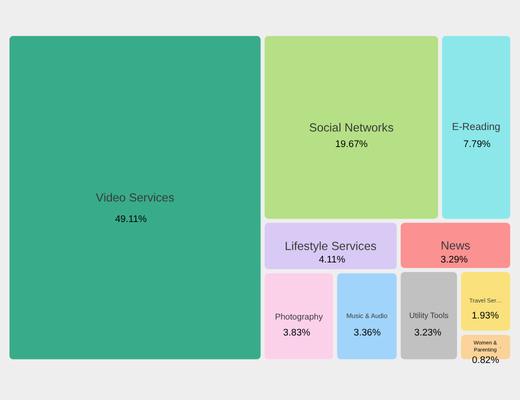
1. Traffic Source Composition

Homepage Recommendation >80%: Indicates that the content aligns with the platform’s distribution logic. Maintain the current style.

Increasing Share of Search Traffic: Signifies successful keyword strategy. Can intensify SEO efforts.

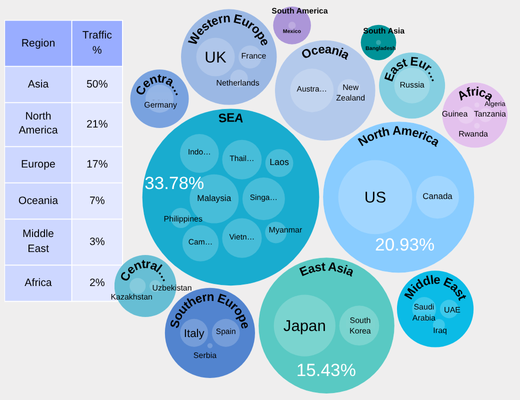
2. Follower Demographics

Pay attention to the distribution of age, gender, and location to adjust content direction. For example, a parenting blogger finding that 70% of their followers are “mothers in second-tier cities” could focus more on recommending cost-effective baby and maternal products.

3. Posting Activity

Maintain a frequency of 3-5 posts per week. Interrupting regular updates will negatively impact your account’s ranking weight.


05 Competitor Data Analysis: Choosing Your Niche by Standing on the Shoulders of Giants

1. Tool Recommendations and Usage Tips

Xinhong/Huitun Data: Spend 60-100 RMB per month to purchase a membership, which allows access to competitor pricing, viral notes, live stream data, and more.

Pugongying Platform: Log in as a merchant to review competitors’ advertising frequency and product categories, assessing the commercial potential of a niche.

2. Three Criteria for Selecting Benchmark Accounts

  • Similar Follower Count: Choose competitors with the same or similar follower scale for more relevant data insights.
  • Stable Update Frequency: Opt for accounts that post at least twice weekly to avoid referencing inactive accounts.
  • Clear Monetization Model: Prioritize accounts that combine both sponsored content and product sales to learn diversified revenue strategies.


06 Data Analysis Methods

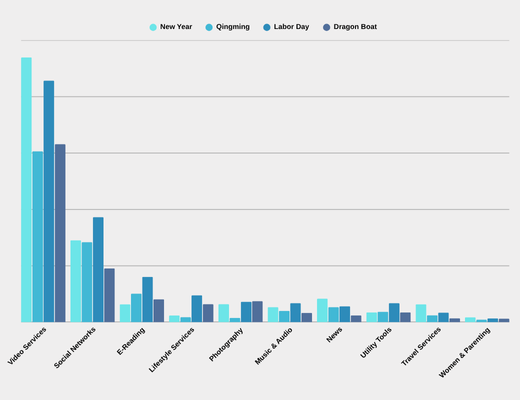
1. Comparative Analysis

Horizontal Comparison: Compare your data with that of competitor accounts during the same period (e.g. engagement rate, follower growth speed), and evaluate the performance of different notes/campaigns/creators.

Vertical Comparison: Compare your account’s data across different time periods (e.g., month-over-month, year-over-year), and analyze performance before and after campaigns.

2. Trend Analysis

  • Track changes in core metrics (e.g., follower count, engagement rate, search traffic) over time to identify growth opportunities or abnormal fluctuations.
  • Analyze periodic or sudden trends in content topic popularity and keyword search volume.

3. Funnel Analysis

Deconstruct the key steps from “users seeing the note” to “conversion” (Exposure -> Click -> Read/Watch -> Interaction -> Product/Link Click -> Add to Cart/Inquiry -> Purchase). Analyze the conversion rate at each stage to identify bottlenecks and drop-off points.

4. Attribution Analysis

Identify the main factors driving key outcomes (e.g., follower growth, conversions). Was it a specific viral note? A campaign? Or consistent high-quality content output?

5. User Segmentation Analysis

  • Segment followers based on behavioral data (activity level, interaction depth, purchasing power) into groups such as core fans, active fans, casual followers, and potential interest fans.
  • Develop tailored operational strategies for different user segments (e.g., retaining core fans, incentivizing active fans, converting casual followers).

6. Content Clustering & Text Analysis

  • Perform text mining on comments and note content to extract high-frequency keywords, sentimenttendency(positive/negative), user concerns, pain points, and needs.
  • Identify common characteristics of viral content (theme, structure, keywords, visual style).

7. A/B Testing

Conduct small-scale tests on key variables (e.g., different cover images, title copy, posting times, campaign formats, call-to-action wording) and select the optimal approach based on data results.


07 Key Considerations for Analytical Practice

Define Objectives and Align Metrics: Before analysis, clearly define the core business objective (e.g., increasing brand awareness? growing followers? driving sales?) and select the most relevant metrics accordingly.

Combine Qualitative Analysis: Qualitative insights from user comments, private message feedback, industry reports, and competitor cases can provide deeper context and understanding, complementing purely quantitative data.

Focus on Metric Correlation: Isolated metrics offer limited value. Pay attention to relationships between indicators (e.g., high exposure but low interaction may indicate insufficient content appeal; high interaction but low conversion may suggest flaws in the conversion funnel).

Long-Term Tracking and Dynamic Adjustment: Operational analysis is an ongoing process. Establish regular review mechanisms and adjust strategies promptly based on data feedback. Platform algorithms and user preferences also change over time.

Leverage Platform Tools Effectively: Make full use of Rednote’s professional backend analytics (note performance, follower data, interaction metrics, referral data), Potato Chip (Shutiao) feed ad campaign data, and third-party data platforms to gain multidimensional insights.

Data Compliance and Privacy: Strictly adhere to platform data usage policies, relevant laws and regulations regarding user privacy protection.

Through systematic data analysis and optimization, combined with an understanding of platform dynamics and user needs, it is possible to achieve breakthrough growth from zero to one on Rednote, ultimately creating viral content and a personal brand that consistently generate value.

Categories
GEO

Unlock The Mistery of Chinese GEO Ecosystem

As generative AI technology reshapes market dynamics in 2025, the way users access information is rapidly shifting from traditional search engines to AI applications. According to Gartner’s forecast, traditional organic search traffic will drop by over 50% by 2026, with 79% of consumers relying on generative AI for information. In this context, YOYI TECH’s GEO-AI brand monitoring Agent (referred to as “YOYI GEO Agent”) has emerged as a key tool for brands aiming to seize the opportunity at the AI-driven knowledge entry point, powered by its multidimensional core advantages such as technology adaptation, functional coverage, data management, and intelligent analytics.


What is GEO and How it Works

GEO, or Generative Engine Optimization, refers to the process of optimizing brand content across owned media (like websites, blogs, and social media pages), paid media (including news outlets, paid social, and influencer accounts), and earned media (such as reviews, social shares, influencer-generated content, and mentions). This optimization enhances brand visibility, Share of Voice (SoV), information accuracy, and positive sentiment within answers generated by AI search engines like ChatGPT, Gemini, Perplexity, DeepSeek, Doubao, Kimi, and others.

The core purpose of GEO is to amplify brand exposure on relevant AI queries and manage the bias in information accuracy. Ultimately, it drives more targeted traffic to your website and social media platforms, increasing product interest and fostering customer conversion and loyalty.

Given the specific AI Large Language Models (LLM) prevalent in China, the GEO landscape in China differs significantly from that abroad. To understand these nuances and leverage them for greater impact, let’s examine key players in the Chinese GEO market.


Comparison of GEO Providers in China vs. Abroad

In the global GEO service field, many providers have emerged, each competing with unique advantages and features. This article analyzes YOYI TECH’s GEO product compared to other global GEO providers, highlighting YOYI TECH’s comprehensive functionality and its suitability for the Chinese market.

Globally, providers like Profound, Otterly.ai, Goodie.ai, and Scrunch have expanded their services internationally, demonstrating robust global market presence. YOYI TECH, however, has strategically focused on the Chinese market, enabling it to deeply understand local needs, policies, regulations, and consumer behavior. In terms of large model compatibility, other providers focus on internationally recognized models such as Google SGE, ChatGPT, and Gemini. YOYI TECH, on the other hand, works with models like DeepSeek and Doubao (Cici), which are more widely used and recognized in China, making its services highly suitable for domestic businesses.

Profound has built the world’s largest real-user AI prompt database, offering comprehensive analytical perspectives, which gives it a significant edge in data-driven analysis. Otterly.ai, with its easy-to-use interface, focuses on monitoring features and offers GEO audit as a first step, attracting users who wish to quickly assess their GEO status. Goodie.ai offers complete functionality, with its attribution algorithm tracking everything from prompt exposure to sales, in collaboration with platforms like Shopify to enhance sales conversion tracking.

YOYI TECH’s standout advantage lies in its precise coverage of the Chinese market. By closely aligning with China’s AI ecosystem and public sentiment, YOYI TECH can quickly identify potential risks in a complex and evolving local environment, helping businesses maintain a positive brand image. Additionally, YOYI TECH ensures compliance with local data regulations, mitigating concerns around data security and privacy. Moreover, YOYI TECH provides accuracy-focused services, ensuring that brand information is accurately presented in China’s large models.


YOYI GEO Agent

YOYI TECH’s GEO product directly addresses the changes in user behavior driven by generative AI. It helps brands become AI-prioritized sources by tackling the trend of “AI search zero-click” and optimizing the generative engine (GEO) process. The core functions of YOYI GEO include:

  • End-to-End Brand Monitoring and Optimization: Real-time tracking of brand content across mainstream large models (such as DeepSeek), ensuring continuous AI prioritization by updating content via dynamic knowledge graphs.
  • Public Sentiment and Risk Defense: Detects misinterpretations or low-quality information in AI-generated content, with a risk alert system that helps businesses address potential public opinion crises.
  • Closed-Loop Verification and Iteration: Supports content verification and model reviews to determine if brand content is incorporated into AI systems, and measures the impact of revisions on AI-generated outcomes. This forms a continuous loop of “Publishing – Monitoring – Optimization.”
  • Multi-Dimensional Intelligent Analysis: Provides deep insights for decision-making, analyzing brand exposure, sentiment analysis, media distribution, and impact.
  • Sophisticated Data Management: Ensures flexible data status control and personalized tagging for companies, offering customizable monitoring solutions that meet the needs of different roles within a company

The Chinese GEO market, with its unique local dynamics, presents a significant opportunity for brands looking to leverage AI for enhanced marketing performance. YOYI TECH’s GEO product provides a comprehensive, data-driven solution that optimizes brand exposure, manages public sentiment, and ensures compliance with local data regulations. By focusing on the local AI ecosystem, YOYI TECH helps brands navigate China’s complex market and build sustainable, high-performance marketing ecosystems.

Source of featured image: Photo by Growtika on Unsplash

Categories
China Marketing

From Mini-Holidays to “Bridge Holidays”: Analysis of 2025 Mid-Year Mini-Holiday Traffic Trends

In today’s digital landscape rapidly evolving with AI, internet traffic flows through the capillaries of platforms and devices, mirroring shifts in social activities and user behavior. With favorable policies making public mini-holidays increasingly commonplace, many employees now opt to take leave on Fridays or Mondays adjacent to weekends. This “bridge holiday” model allows them to steal a break and find some breathing room, functionally resembling traditional mini-holidays. Consequently, mini-holidays hold significant reference value for brand marketing and tourism destination planning. To gain deeper insights into user internet behavior patterns during these periods, YOYI Tech conducted a comprehensive analysis of internet traffic across four major 2025 mini-holidays: New Year’s Day, Qingming Festival, Labor Day, and Dragon Boat Festival.

The four sampled mini-holidays exhibit diverse durations, ranging from 1 to 5 days:

  • New Year’s Day (Jan 1): A standalone mid-week holiday on Wednesday.
  • Qingming Festival (Apr 4–6): A 3-day break spanning Saturday to Monday.
  • Labor Day (May 1–5): An extended 5-day period including a weekend.
  • Dragon Boat Festival (May 31–Jun 2): A 3-day holiday incorporating a weekend.

This variety of holiday structures—differing in length and timing—provides multifaceted samples for analyzing user internet behavior across distinct vacation scenarios.


01 Mini-Holiday Recharge: Seeking Work-Life Balance

According to traffic data from YOYI TECH’s DNA platform, during these mini-holidays, OTT devices captured 11% of traffic, primarily reflecting entertainment beyond work contexts, especially family-centric activities like TV series watching and big-screen gaming. Mobile devices dominated with an overwhelming 80% share, functioning mainly as entertainment hubs while accommodating limited non-entertainment scenarios (e.g., remote work/learning). PCs accounted for 9% of traffic, largely serving non-entertainment purposes such as work and study. Some users continued handling work assignments and academic tasks even during breaks. Notably, despite smartphones’ entertainment supremacy, a significant user segment actively pursued personal growth and career advancement.

Table 01: 2025 H1 Mini-Holiday Traffic Distribution by Device, Data Source: YOYI TECH DMP


02 Mini-Holiday Attributes & Duration: Core Drivers of User Behavior

Drilling deeper into individual holidays, YOYI observed elevated OTT traffic during Labor Day and New Year’s Day—directly correlated with concentrated premieres of May Day and New Year seasonal film and TV releases. As a symbolically significant year-start milestone, New Year’s Day saw more families, couples, and friends opting for at-home TV celebrations—notably countdown events and leisure viewing. Concurrently, these two mini-holidays recorded peak PC usage, reflecting greater demand for clearing work backlogs and academic tasks. New Year’s Day fell precisely on the pivotal point of the week – Wednesday – while the Labor Day holiday spanned five days, making it relatively longer. Consequently, users needed to account for more variables arising from non-leisure scenarios like work and studies when planning their holiday arrangements.

Table 02: 2025 H1 Daily Mini-Holiday Traffic Distribution by Device, Data Source: YOYI TECH DMP


During Qingming Festival, mobile and OTT traffic dipped to their lowest levels among all holidays—a direct reflection of outdoor traditions like spring outings and ancestral rites, which naturally subdued entertainment engagement. During the Dragon Boat Festival, entertainment scenarios represented by OTT and mobile devices, and work and study scenarios represented by PCs, showed a relatively balanced distribution. While gathering with family and enjoying festival traditions, people relaxed using phones and TVs, while also moderately attending to work and studies via computers.


03 Daily Traffic Patterns: Dual Evening Peaks on New Year’s Day

Analyzing overall daily traffic trends across the four mini-holidays, YOYI observed consistent pre-dawn troughs (0-6 AM). As mornings progressed (6-9 AM), traffic gradually ascended—likely driven by early risers checking updates and planning daily itineraries. Steady growth continued through late morning (9 AM-12 PM), followed by a mild midday dip (12-2 PM) during lunch breaks.

Table 03: 2025 H1 Full-Day Mini-Holiday Internet Traffic Flow Patterns (Daily Average), Data Source: YOYI TECH DMP


From 2 PM to 8 PM, traffic resurged, peaking around 20:00 as dependency on digital resources intensified for work and study tasks. Distinctively, New Year’s Day exhibited dual evening peaks: the first arriving 2 hours earlier at 18:00, followed by a secondary uptick (20:00–21:00)—a unique phenomenon tied to pre-dinner gatherings and celebration preparations absent in other holidays. Post-21:00, traffic gradually declined across all four holidays, signaling users’ transition toward rest after outdoor activities. Collectively, New Year’s Day and Labor Day recorded higher daily traffic volumes; the former leveraged its distinctive commemorative significance, while the latter’s extended duration created pivotal windows for brands to capture concentrated online engagement.


04 Video, Reading & Social: The Triple Traffic Anchors of Mini-Holidays

Among the top 10 media types by daily traffic during mini-holidays, video platforms dominated with 49% share, fulfilling heightened entertainment demand through short videos, series, films, and variety shows. Social networks followed at 20%, channeling holiday experience sharing and social interactions. Digital reading platforms captured 8% as the third anchor,, validating users’ essential self-improvement needs. The remaining Top 10 slots were claimed by lifestyle services, photo enhancement tools, music/podcast platforms, news outlets, utility apps, travel services, and family-focused content, collectively reflecting user’s integrated demands for daily convenience, moment preservation, leisure travel, and real-time information access.

Table 04: Top 10 Media Types During 2025 H1 Mini-Holidays, Data Source: YOYI TECH DMP


The Top 10 media types exhibited distinct daily traffic fluctuations across mini-holidays, reflecting dynamic interplays between holiday attributes and user needs. Video service traffic surged significantly during New Year’s Day and Labor Day compared to Qingming and Dragon Boat Festivals. As a symbolic year-start milestone, New Year’s Day saw platforms concentrating premium content like gala broadcasts and new-year series premieres, aligning with home-based entertainment demands for year-end celebrations. Meanwhile, the extended 5-day Labor Day break fostered multi-scenario video consumption—whether at home or during travel—propelling traffic growth. Conversely, Qingming and Dragon Boat Festivals recorded traffic dips as outdoor ritual activities (ancestral rites/dragon boat racing) dominated, prompting users to step away from immersive screens temporarily.

Labor Day witnessed the most pronounced digital reading traffic surge. The extended 5-day break propelled users’ self-enhancement and planning pursuits, driving engagement with e-books and knowledge columns—while also capitalizing on fragmented intervals during transit. This precisely met lightweight knowledge acquisition demands, catalyzing distinctive traffic growth.

Table 05: 2025 H1 Top 10 Media Daily Traffic Distribution During Mini-Holidays, Data Source: YOYI TECH DMP


For social platforms, Labor Day traffic peaked—fueled by extended break duration and diverse activities that spurred frequent check-in sharing and intensified interaction needs, while utility-driven engagements like bridge-holiday hacks and travel coordination further amplified usage. Conversely, Qingming and Dragon Boat Festivals saw dispersed social demand and lower traffic due to shorter durations and ritual-focused engagements.

Regarding lifestyle services, Labor Day maintained dominance with Dragon Boat Festival trailing closely. The 5-day Labor break propelled consumption scenarios (food delivery, home services, ticketing, transport), becoming key traffic drivers. Meanwhile, Dragon Boat Festival generated robust demand through ritual-themed commerce (zongzi, mugwort, dragon-boat gear) and excursion logistics, sustaining elevated traffic.


05 Overseas Travel: Asian Dominance with Neighbor Focus

During 2025 H1 mini-holidays, outbound traffic revealed a “Asia-centric, neighbor-prioritized” pattern. Asia captured an absolute majority at 50% traffic share, with high-density clusters in Southeast Asia (33.78%) and East Asia (15.43%). On one hand, within Southeast Asia, countries like Indonesia, Thailand, and Malaysia showed the highest traffic concentration. Attracting users with their “travel value-for-money + geographical convenience,” they aligned perfectly with the short, sharp getaway rhythm of mini-holidays. On the other hand, in East Asia, Japan and South Korea emerged as major traffic hotspots. With dense direct flight networks and high cultural compatibility, they became users’ top choice for light-planning, experience-focused trips.

Table 06: 2025 H1 Outbound Traffic Statistics for Top 30 Countries During Mini-Holidays, Data Source: YOYI TECH DMP


In secondary markets, the Americas captured 21% of traffic—primarily driven by the business-leisure duality in the United States and Canada. During mini-holidays, some business travelers bridged work commitments with leisure time. Combined with North America’s diverse natural landscapes and urban experiences, this attracted medium-to-long trip vacationers. Europe accounted for 17% of cross-border travel traffic during mini-holidays, with Western European nations like the UK and France, alongside Southern European destinations such as Italy and Spain, making the list. However, due to distance and complex visa requirements, its traffic share lagged behind Asia, better suiting travelers seeking extended-vacation long-haul trips.

The regional distribution of outbound traffic fundamentally reflects the alignment between mini-holiday time constraints and destination attributes. Given the compressed holiday duration, travelers gravitate toward destinations with shorter flight durations and streamlined itineraries—naturally positioning Asian neighbors as optimal choices. Meanwhile, experience-specific synergies emerge: Southeast Asia’s tropical leisure pursuits, East Asia’s cultural tourism consumption, and Euro-American deep-immersion offerings precisely cater to divergent holiday expectations. Moreover, Asia’s comparative cost advantages—in transportation, expenditure, and visa accessibility—reduce both economic and temporal investments, further reinforcing its gravitational pull on traffic concentration.

Asia’s neighboring destinations function as the absolute core of mini-holiday outbound traffic—an inevitable outcome of travelers prioritizing brief duration, low barriers, and high-impact experiences. Consequently, to strategically capture this demand, Asian destinations must enhance frictionless last-minute travel products, while long-haul locales like Europe and America should focus on bridge-holiday augmented deep-dive journeys, thereby precisely converting traffic potential into market value.


Conclusion

The internet traffic patterns during the 2025 H1 mini-holidays unveiled multifaceted characteristics across device usage, daily flow trajectories, media engagement, and outbound mobility. Key insights are summarized below:

01 Users balanced leisure and work during mini-breaks at a 9:1 ratio, actively pursuing work-life equilibrium.

02 Holiday attributes and duration significantly influenced user behavioral decisions.

03 Twin traffic peaks emerged on New Year’s Eve, presenting critical moments for concentrated brand campaigns and online traffic capture.

04 Video content, digital reading, and social networks formed the three core traffic drivers.

05 Cross-border travel trended toward Asian neighbors predominantly, with Americas/Europe as supplementary long-haul destinations.

These traffic patterns provide vital references for brand marketing, destination promotion, and digital content creation, empowering industries to precisely align with user needs and develop market-responsive strategies.

Source of featured image: Photo by Kylo on Unsplash

Exit mobile version